Plan a project
See how concept-mapping a project plan helps you to organise and communicate.
Add aspects, views, colours and filters to your data to gain insights
Is it another mind-mapping tool? - Who is it for?
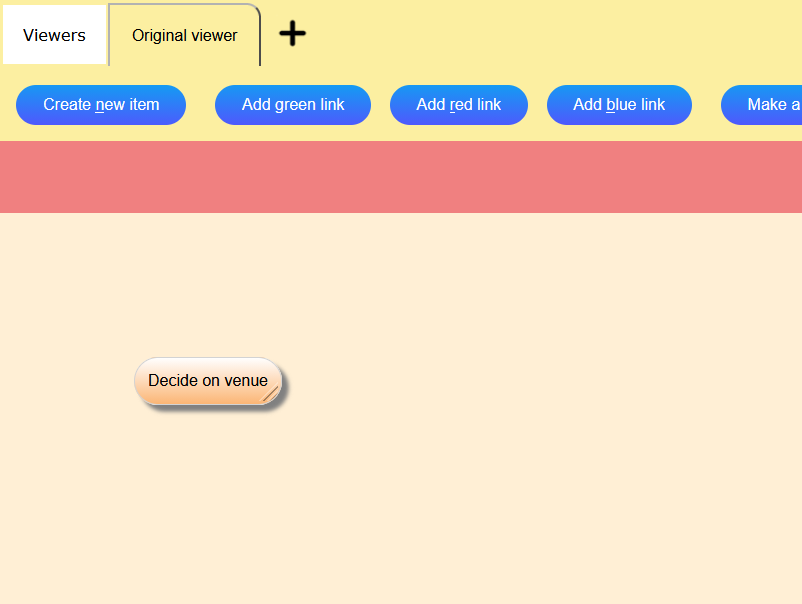
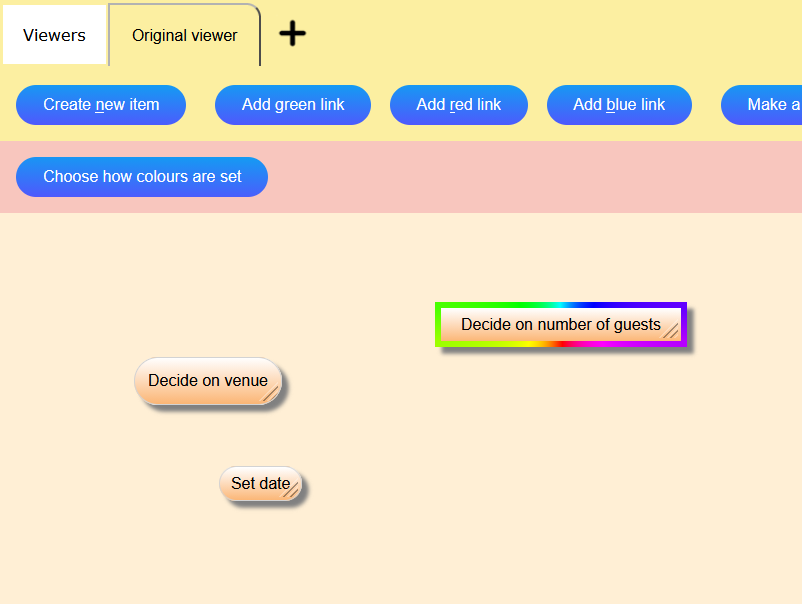
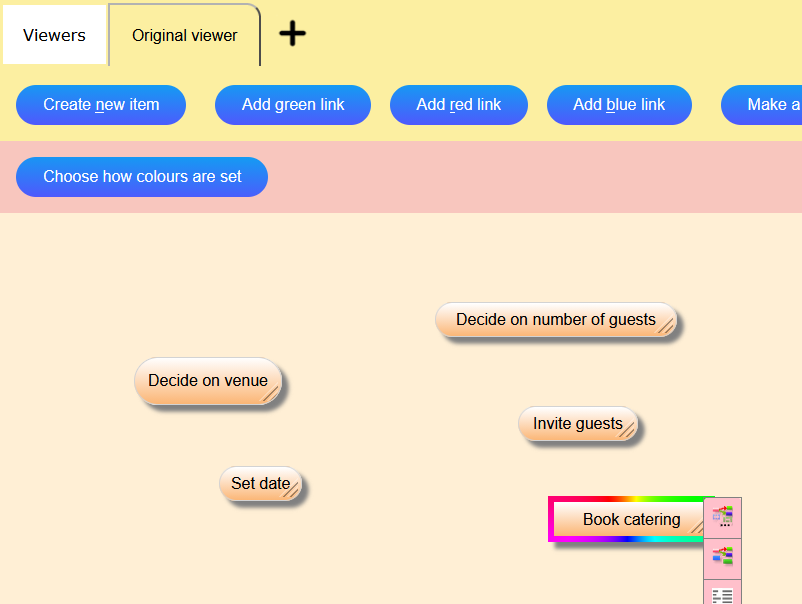
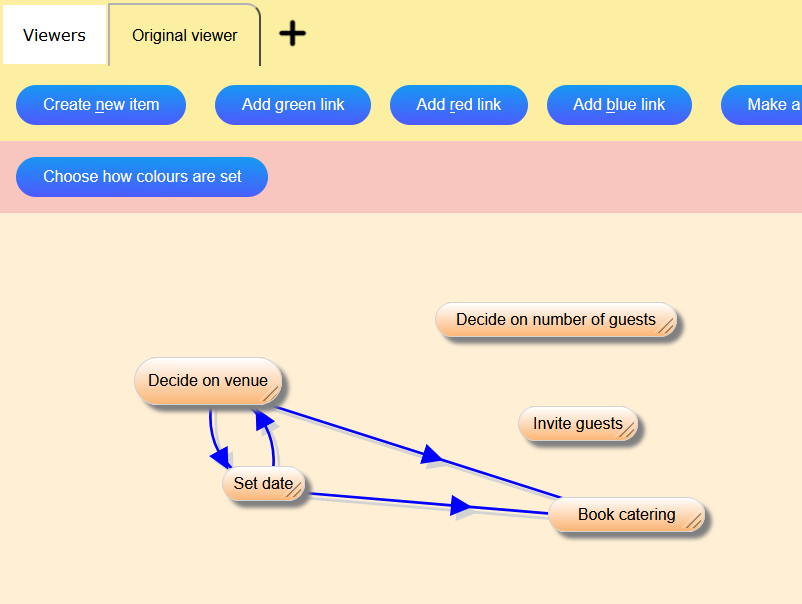
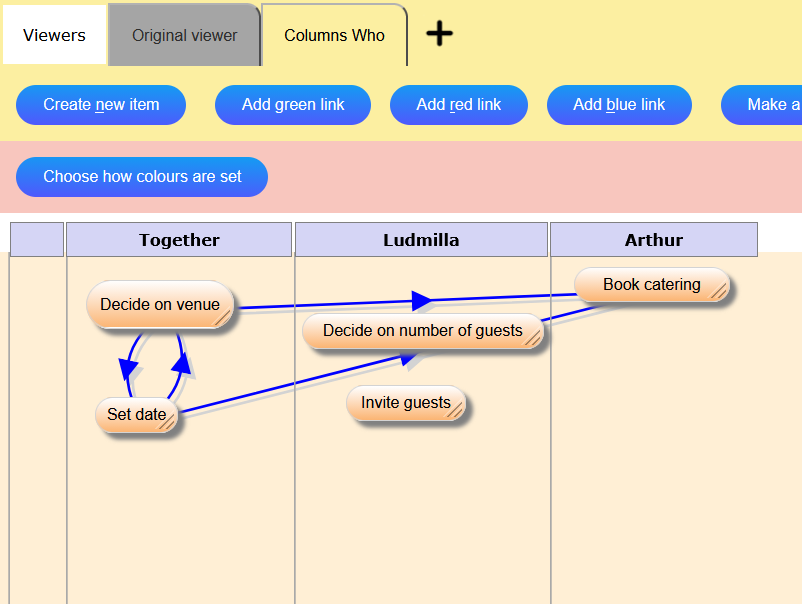
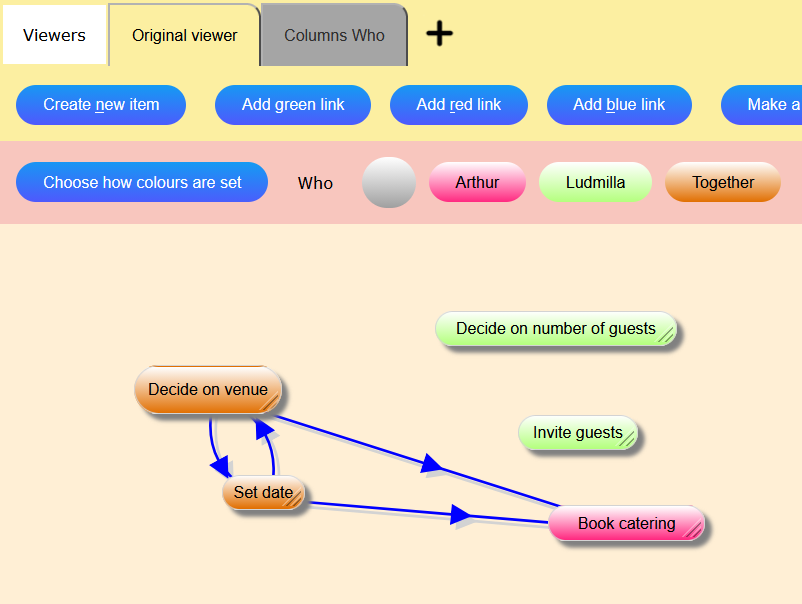
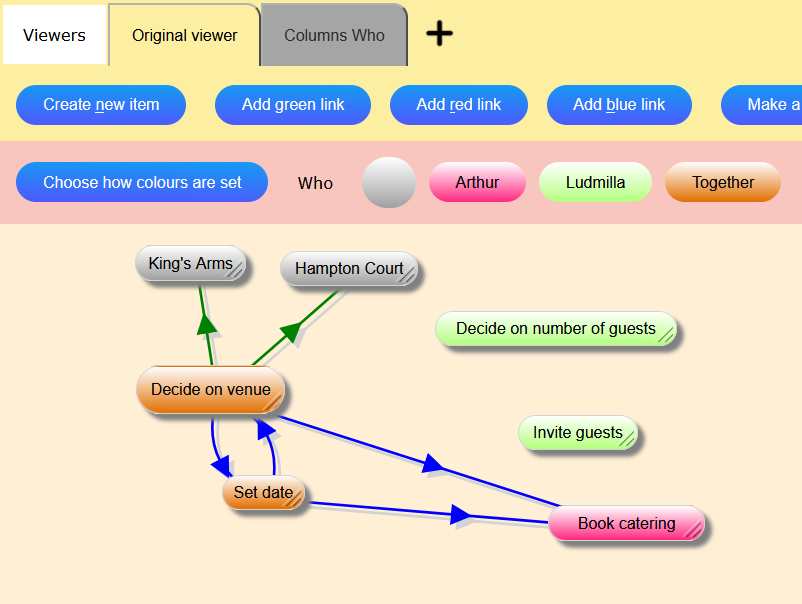
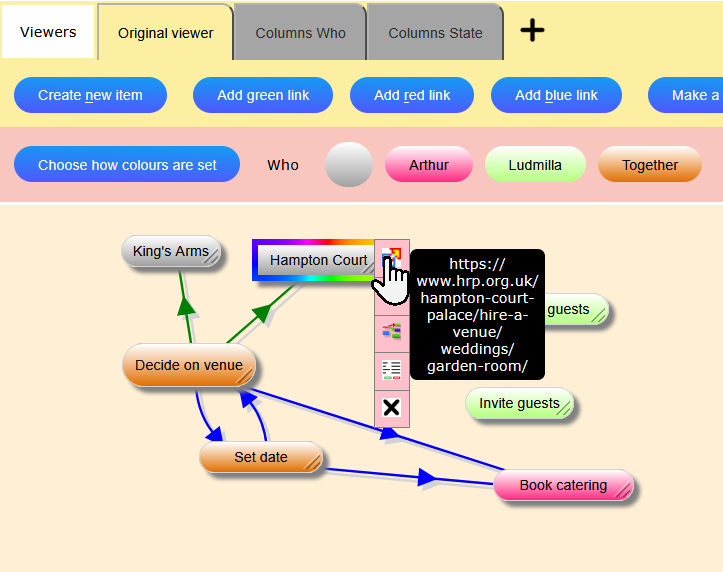
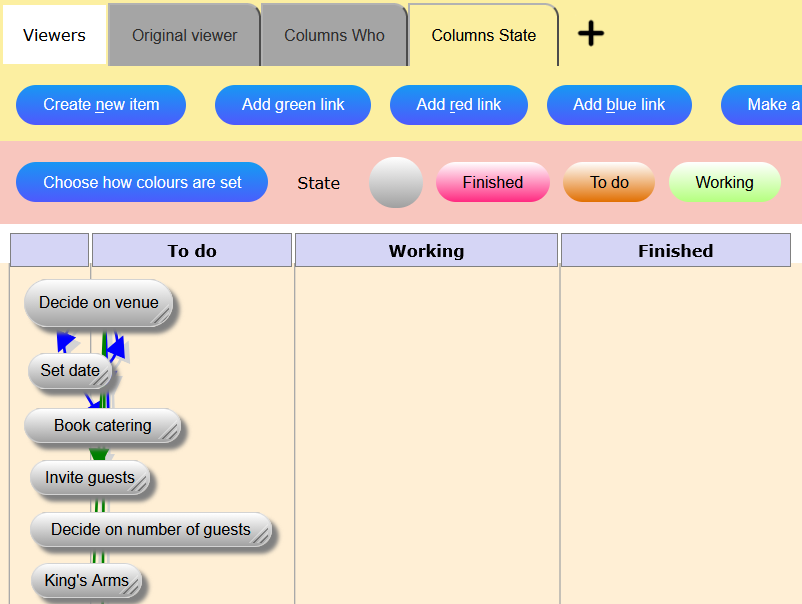
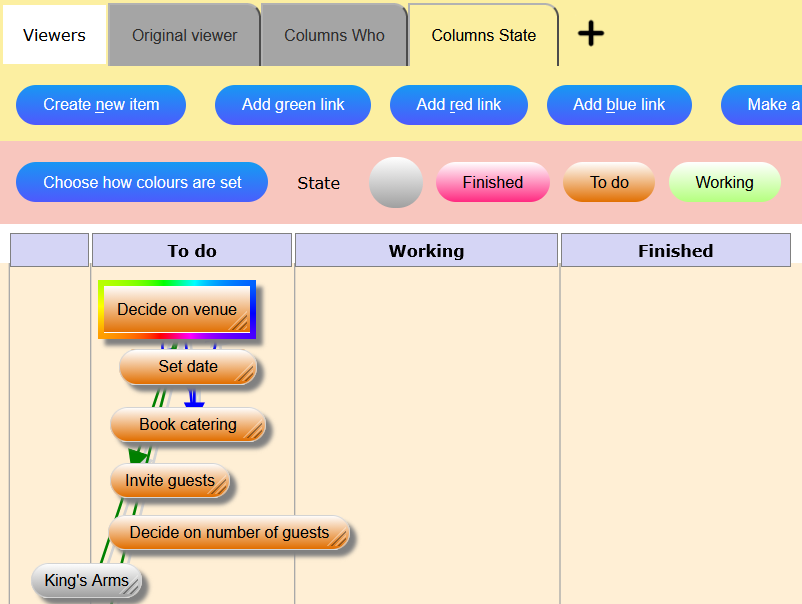
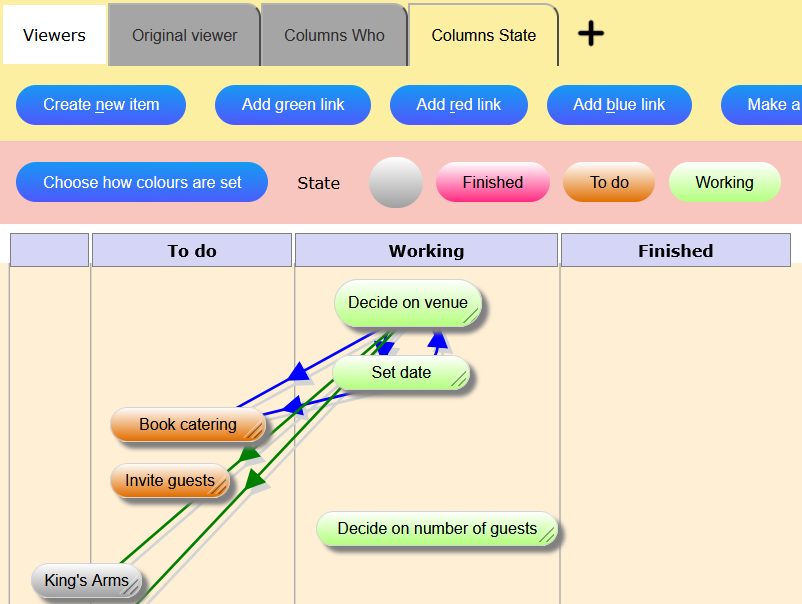
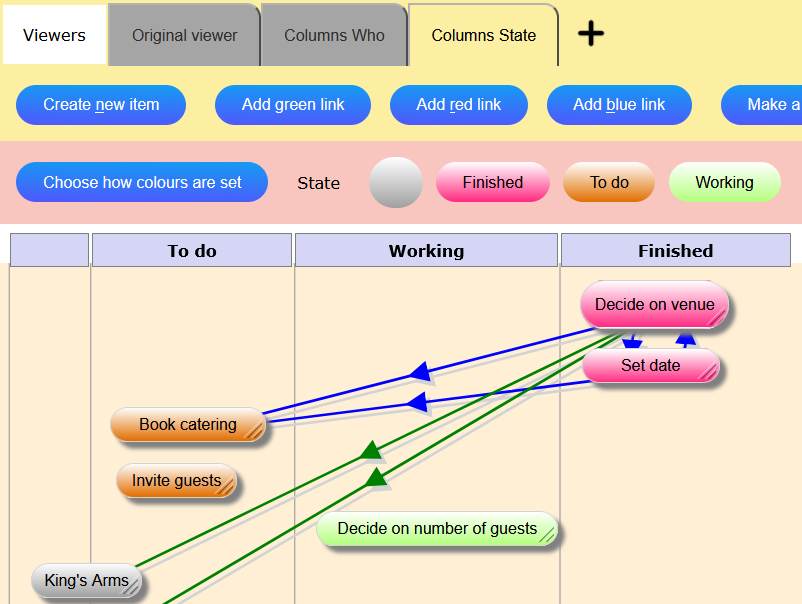
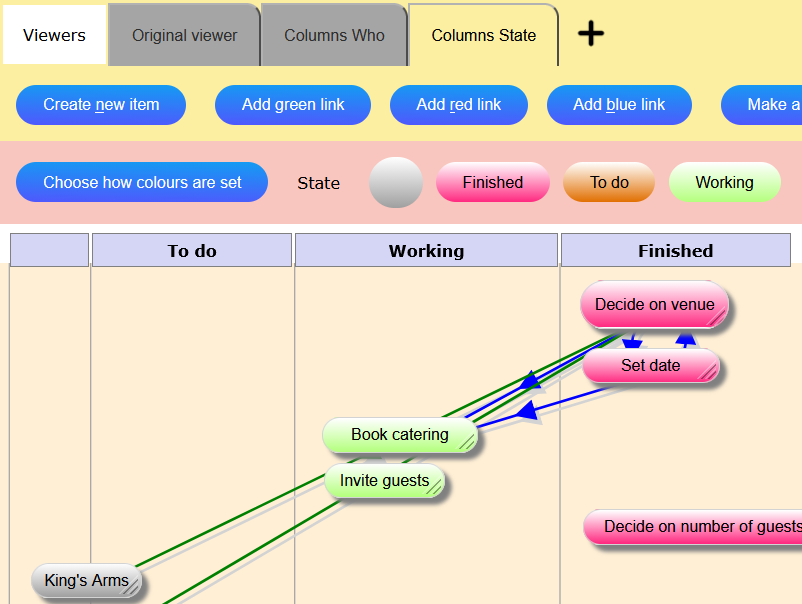
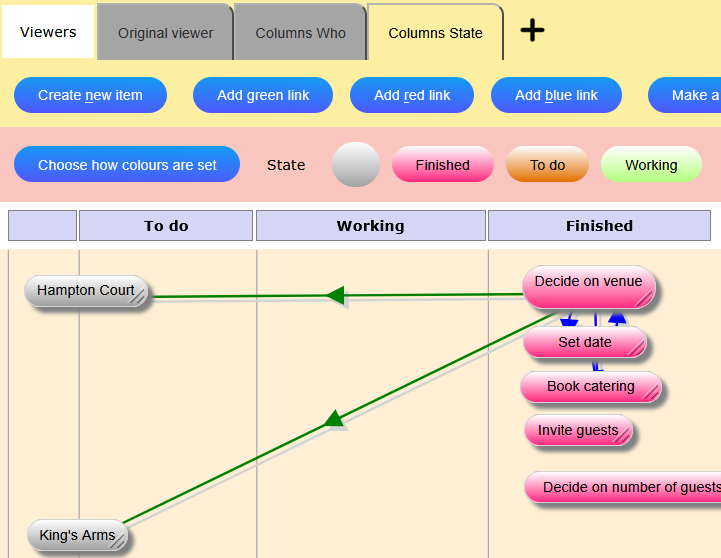
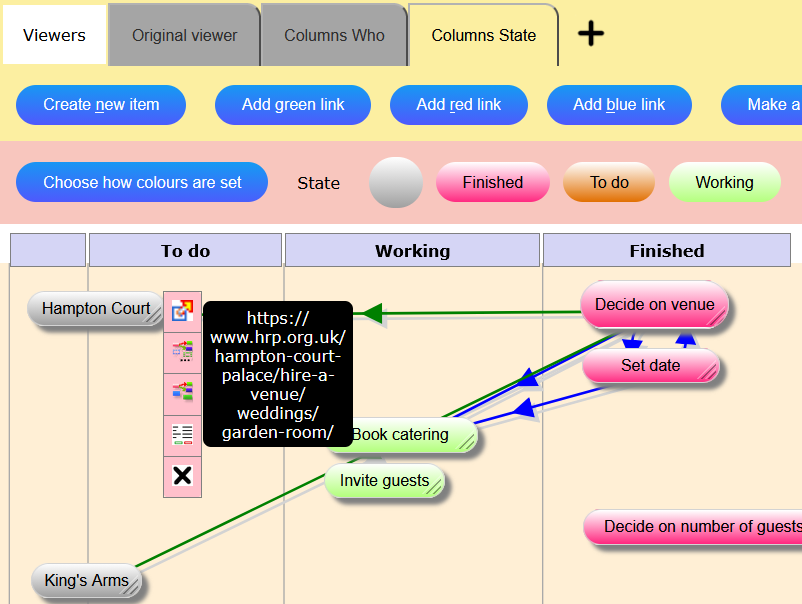
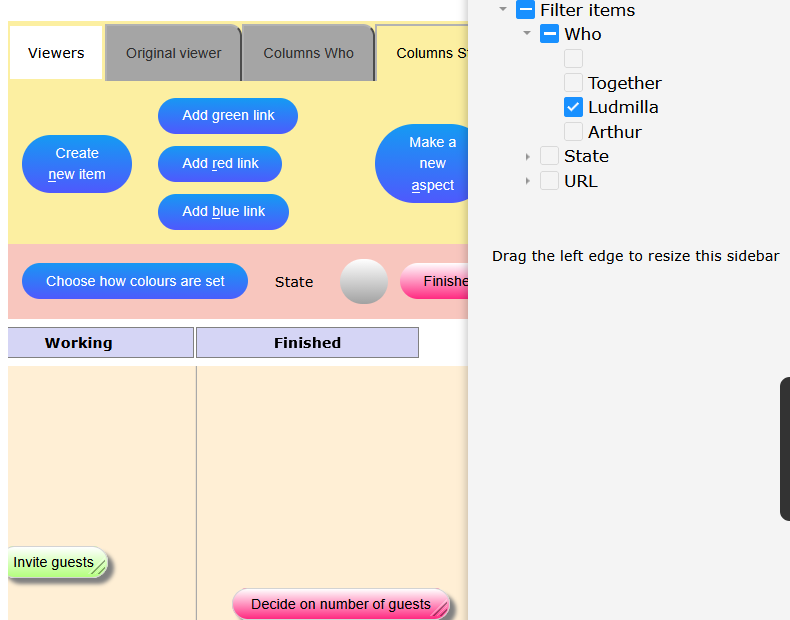
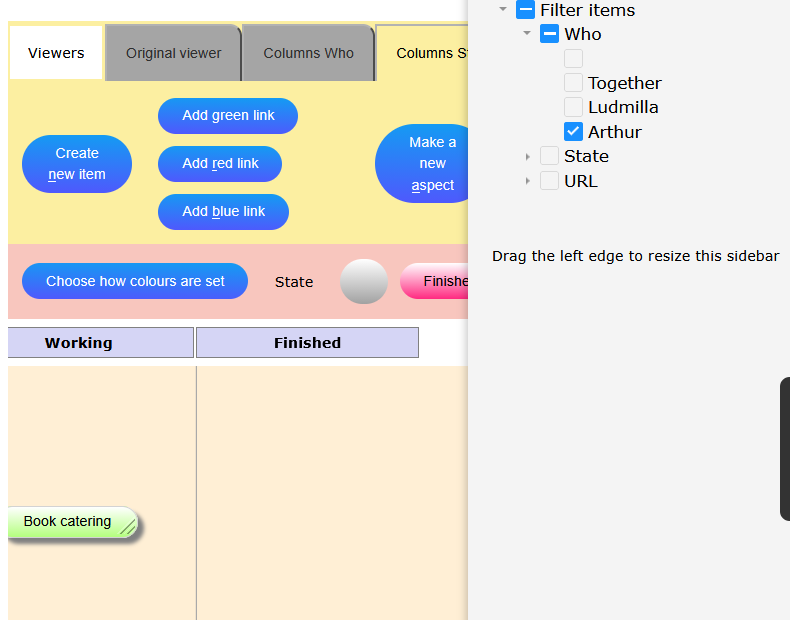

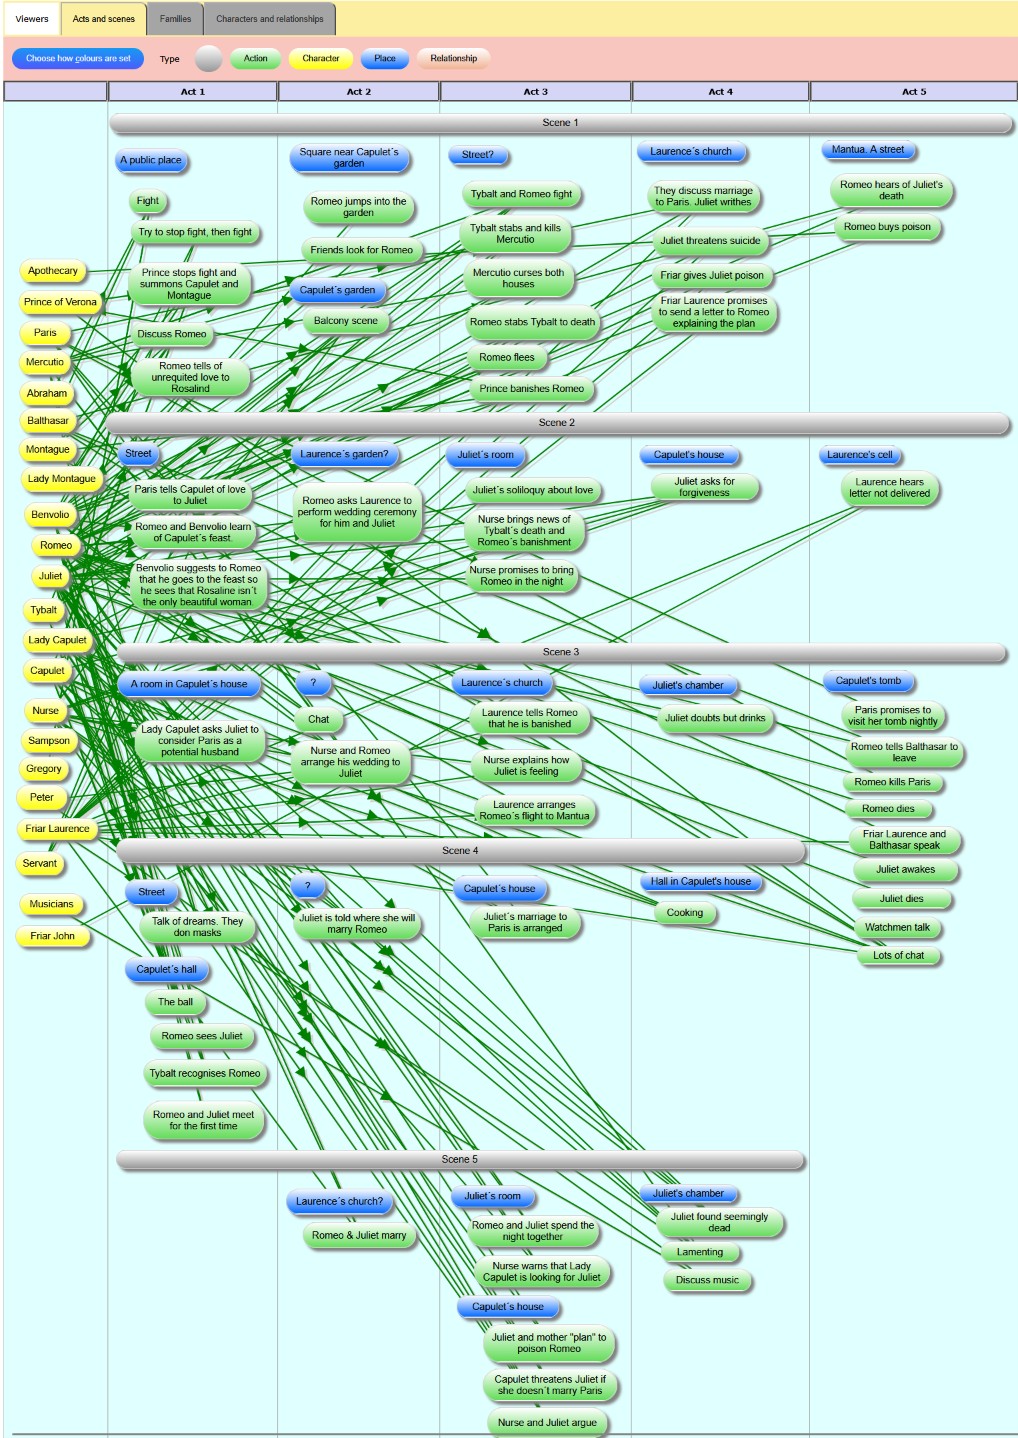
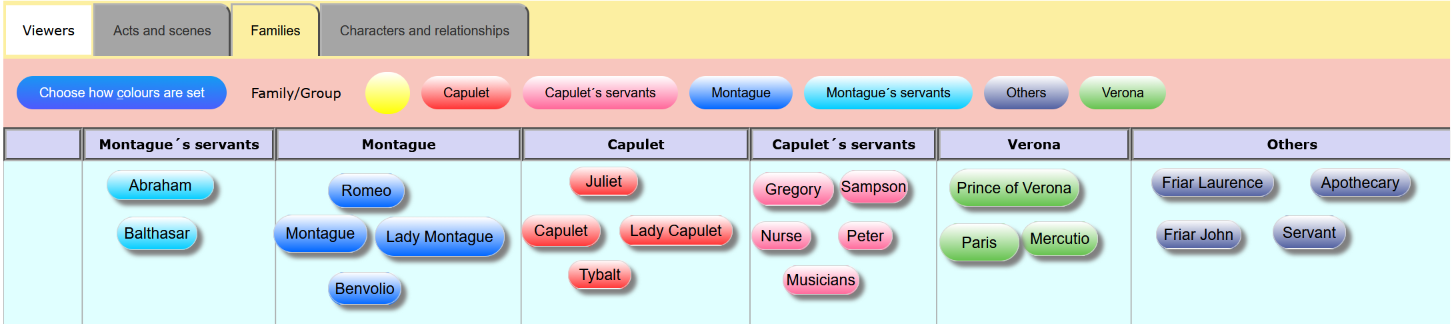
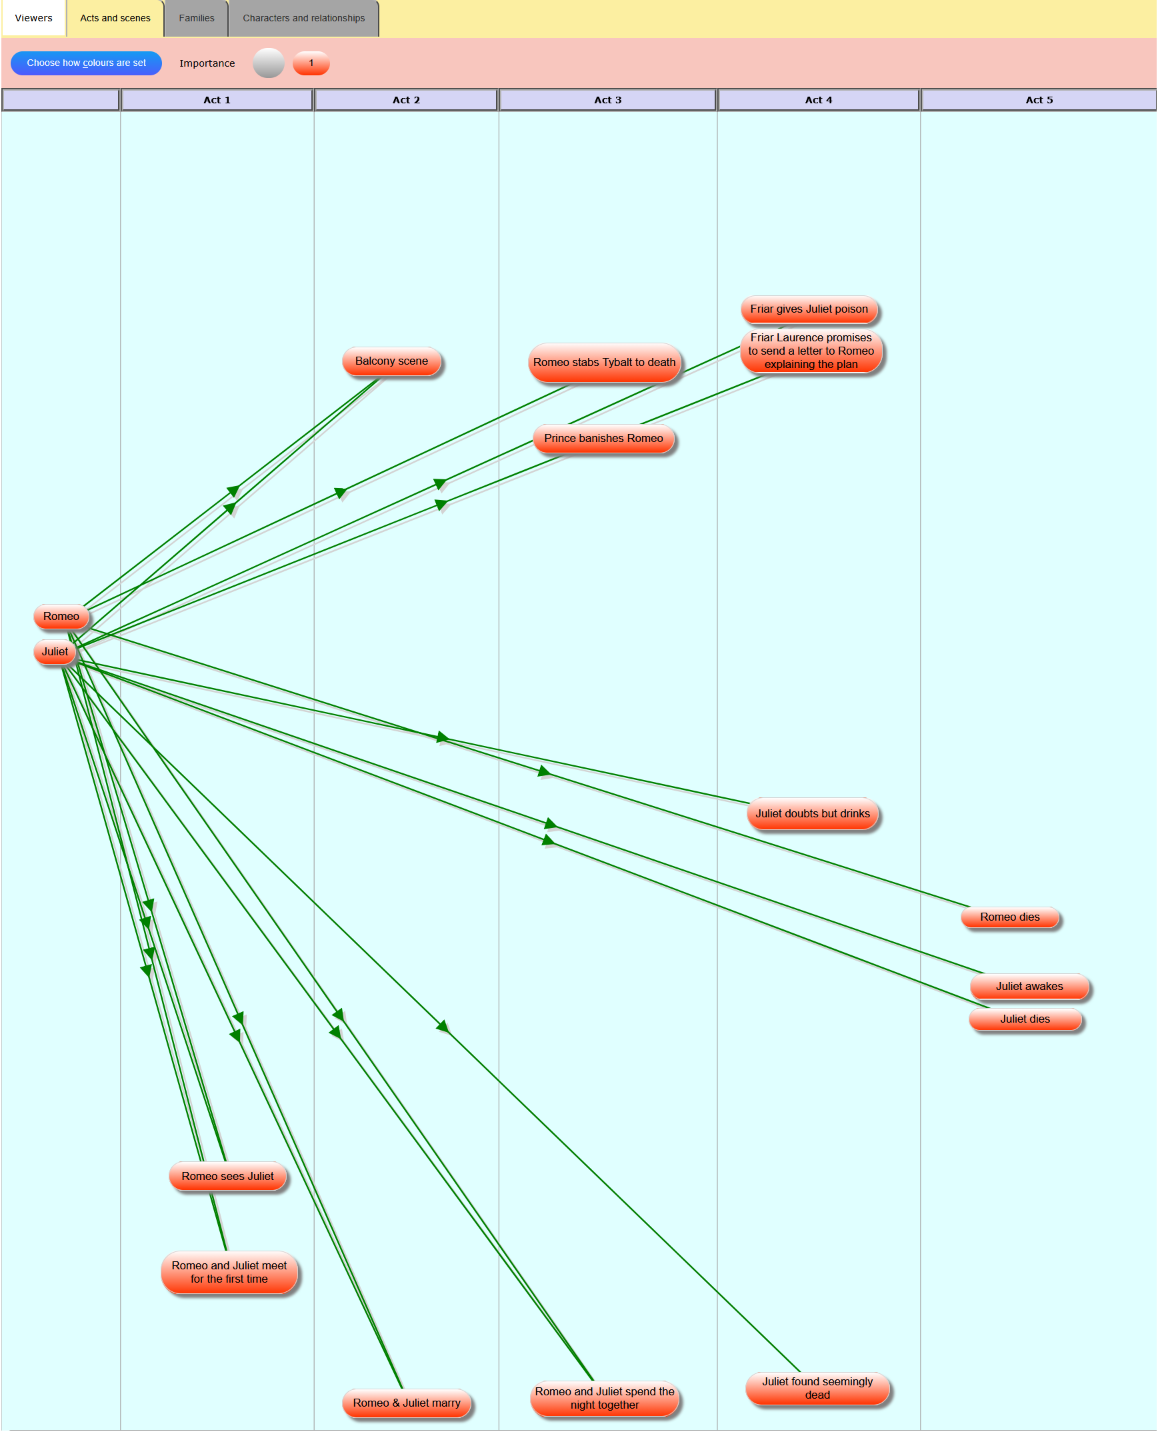
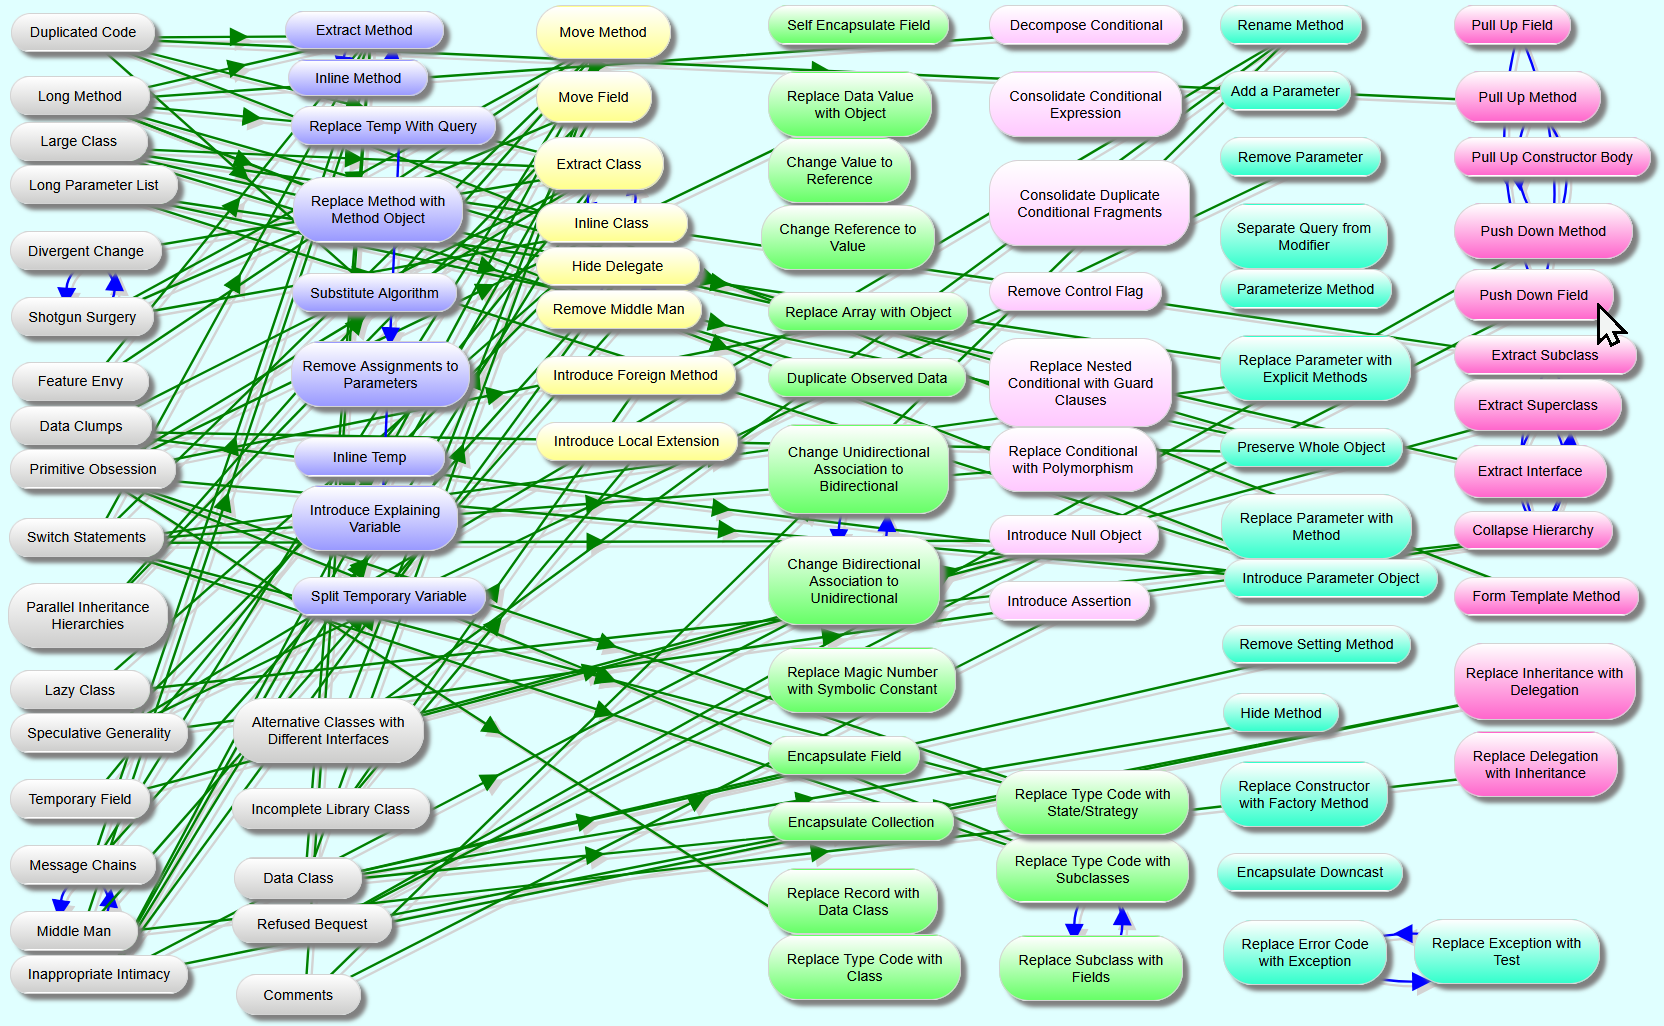
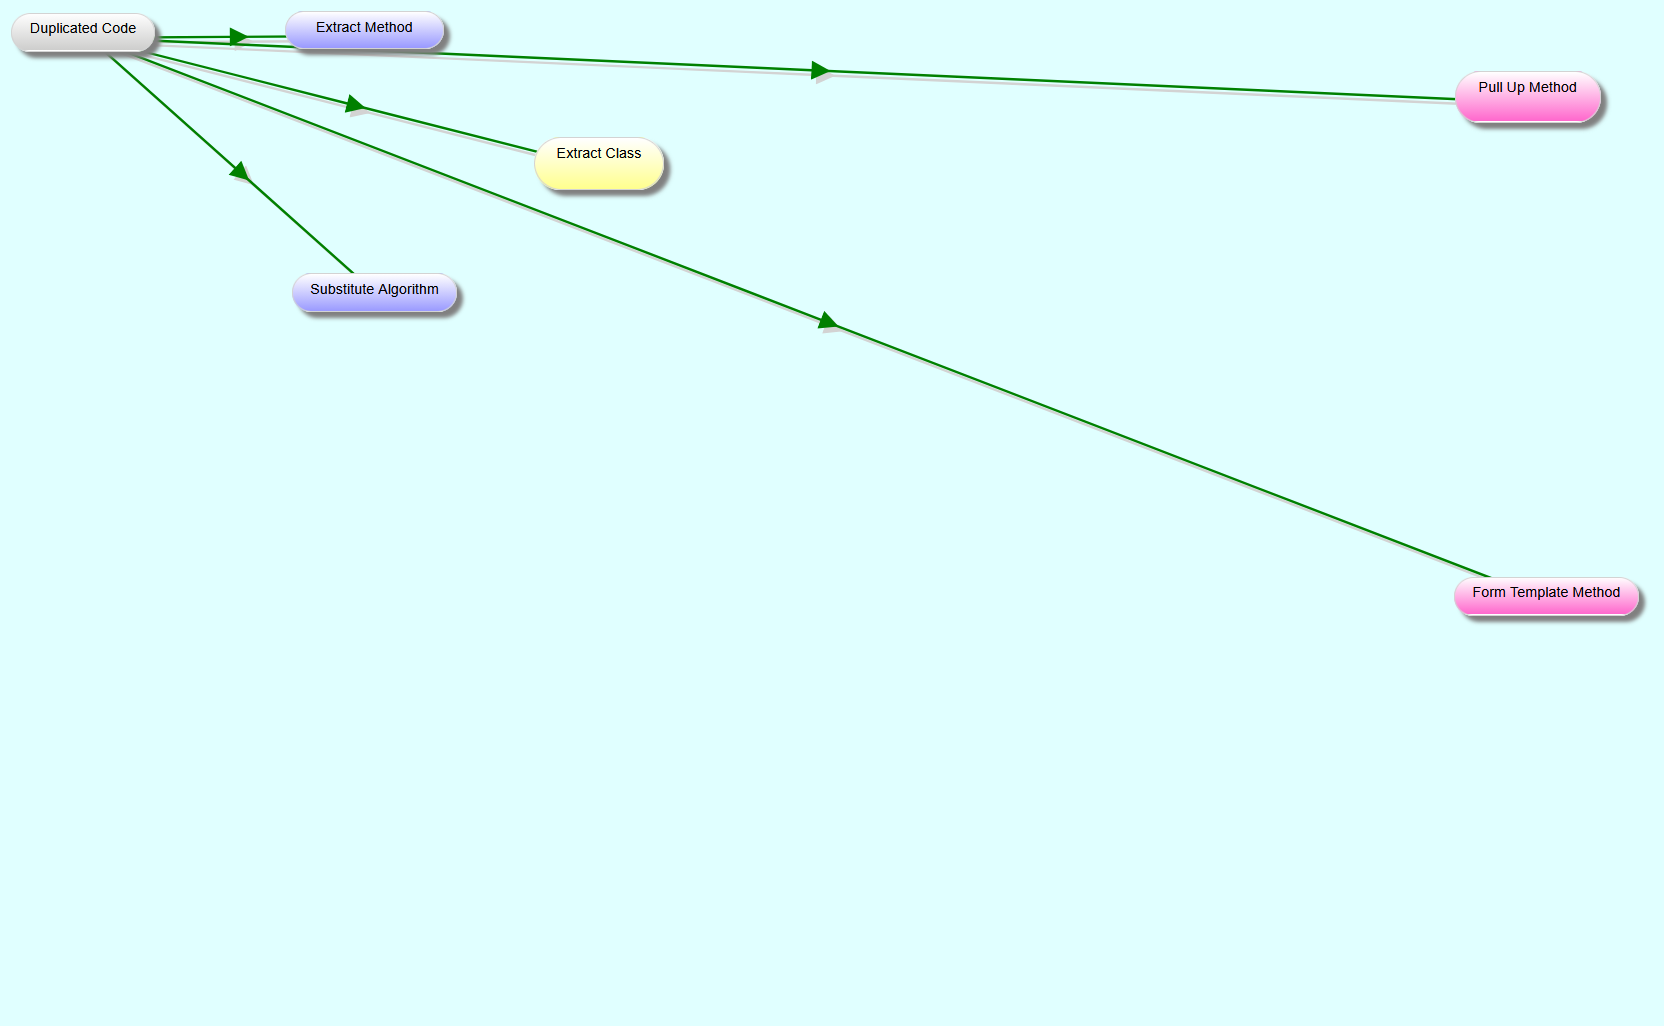
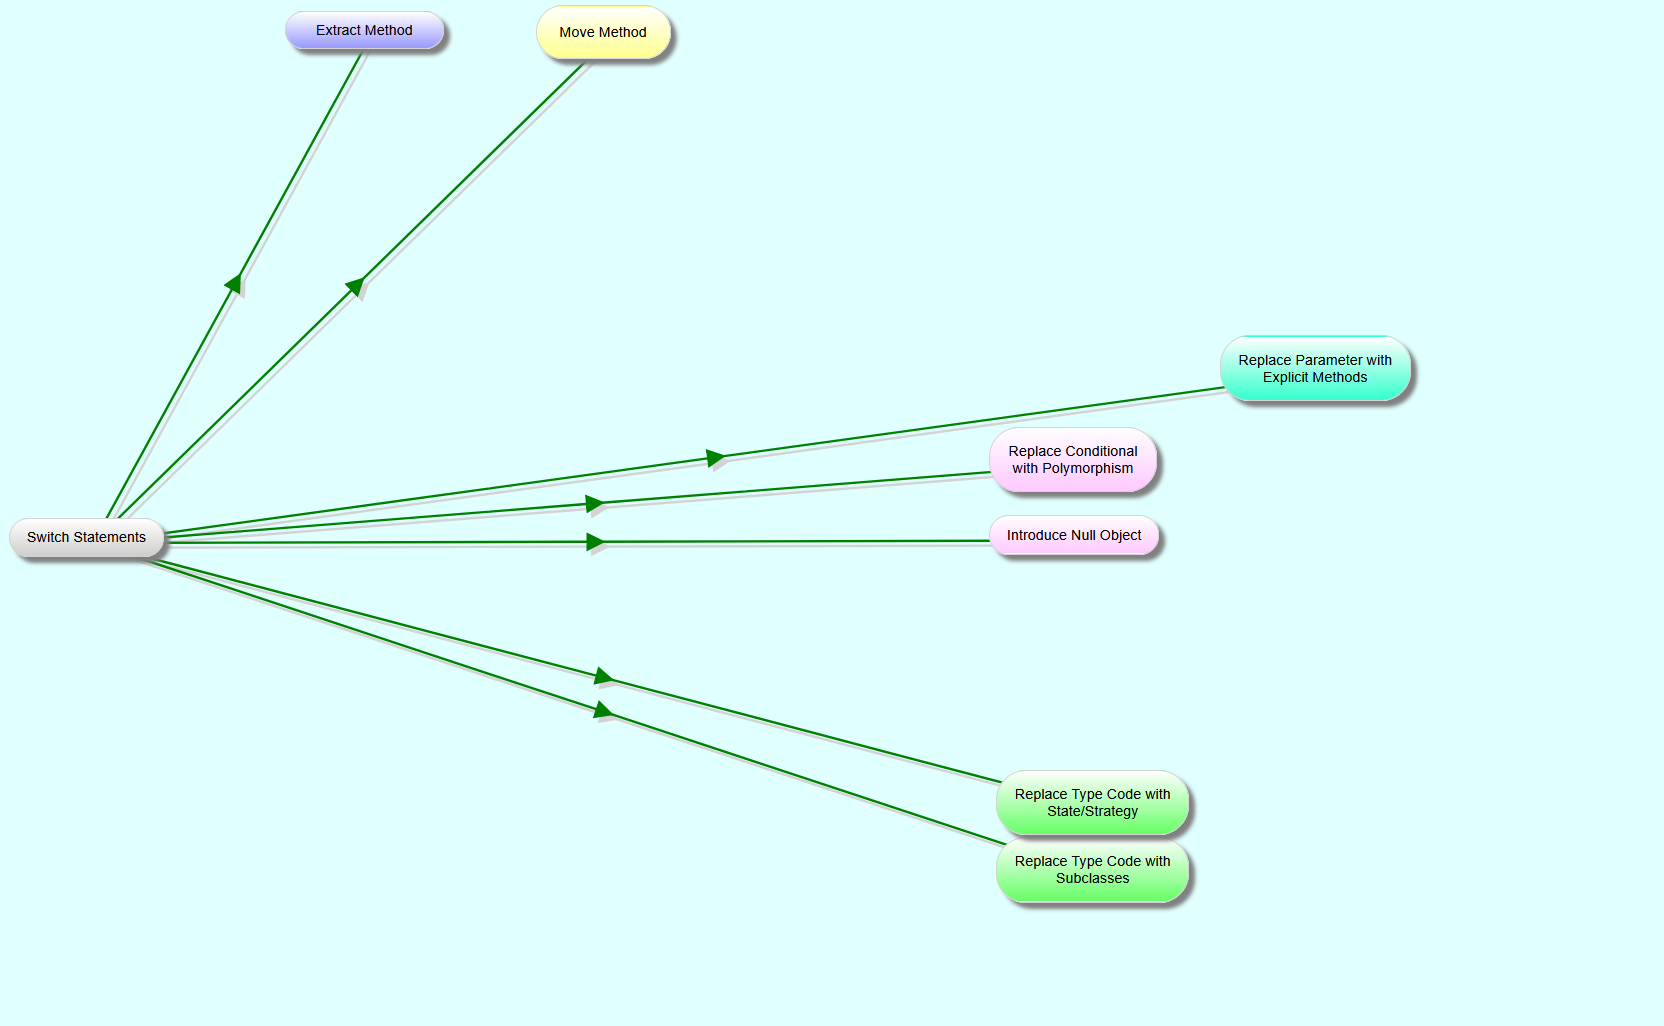
After looking through the slides above, select one of the examples below for more details.
See how concept-mapping a project plan helps you to organise and communicate.
Explains how SortYourThoughts helps mediators by showing all parties the current state of negotiations and allowing them to change it.
Use colours to show structure and details in static data using Java collection classes as an example.
Diagrams of Romeo and Juliet showing various types of relationship.
A general introduction to the capabilities of this software.
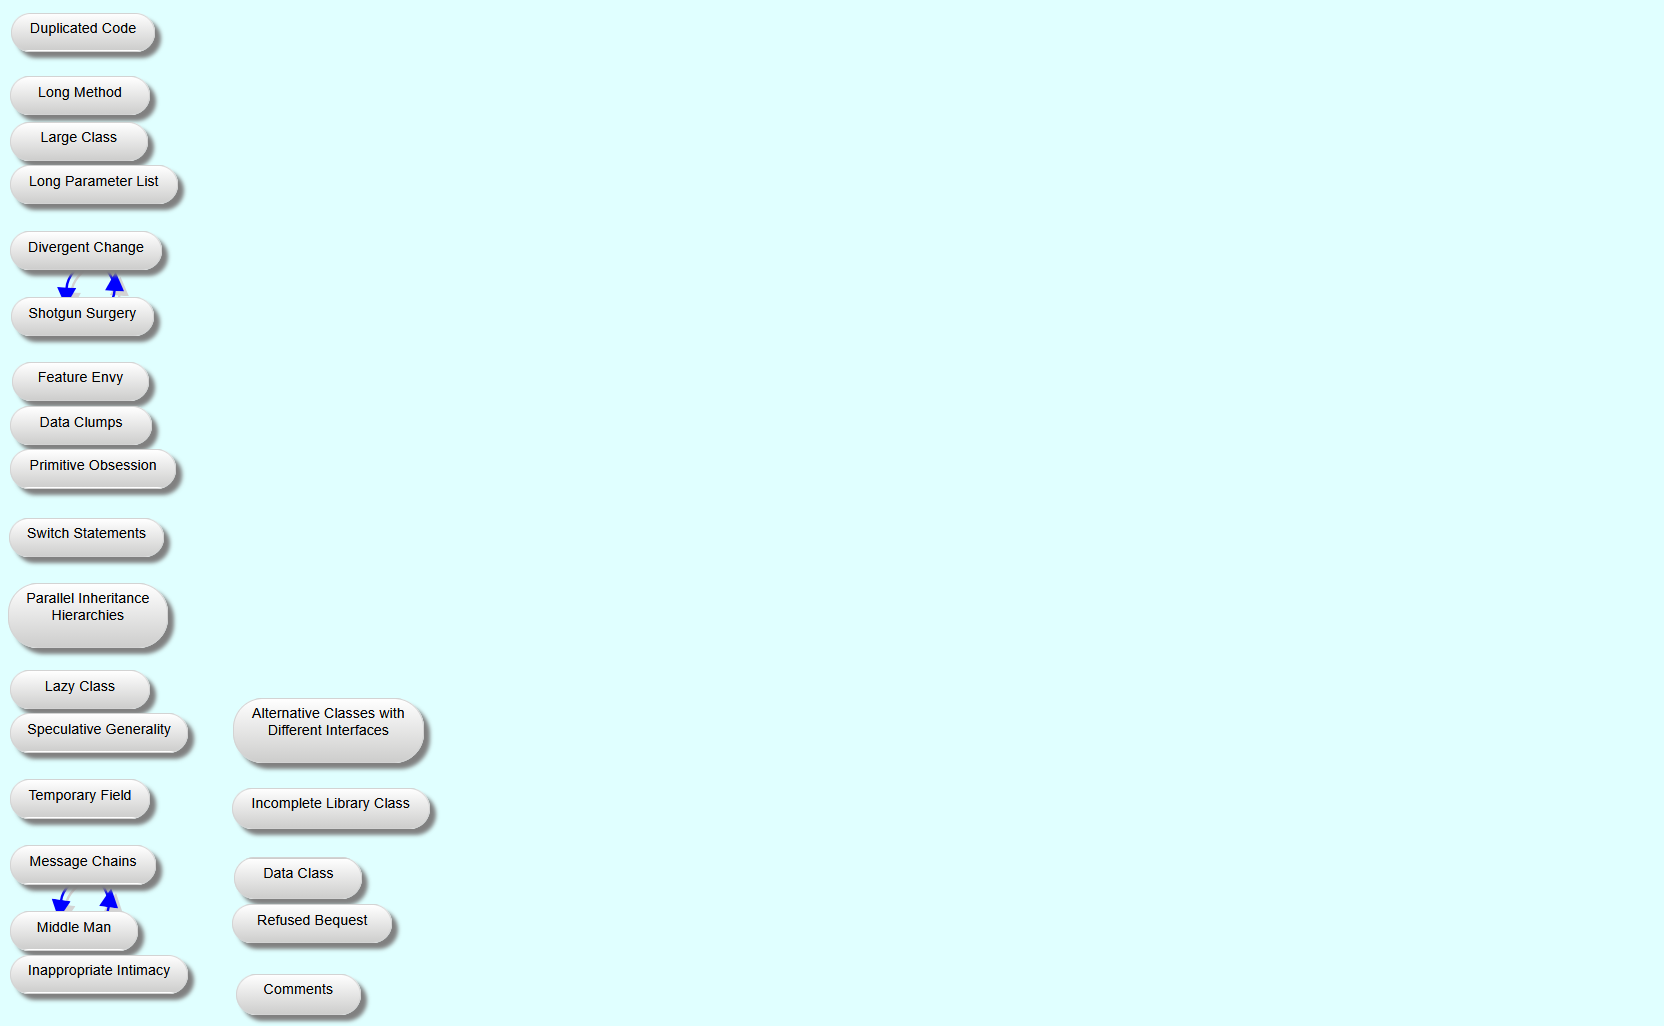
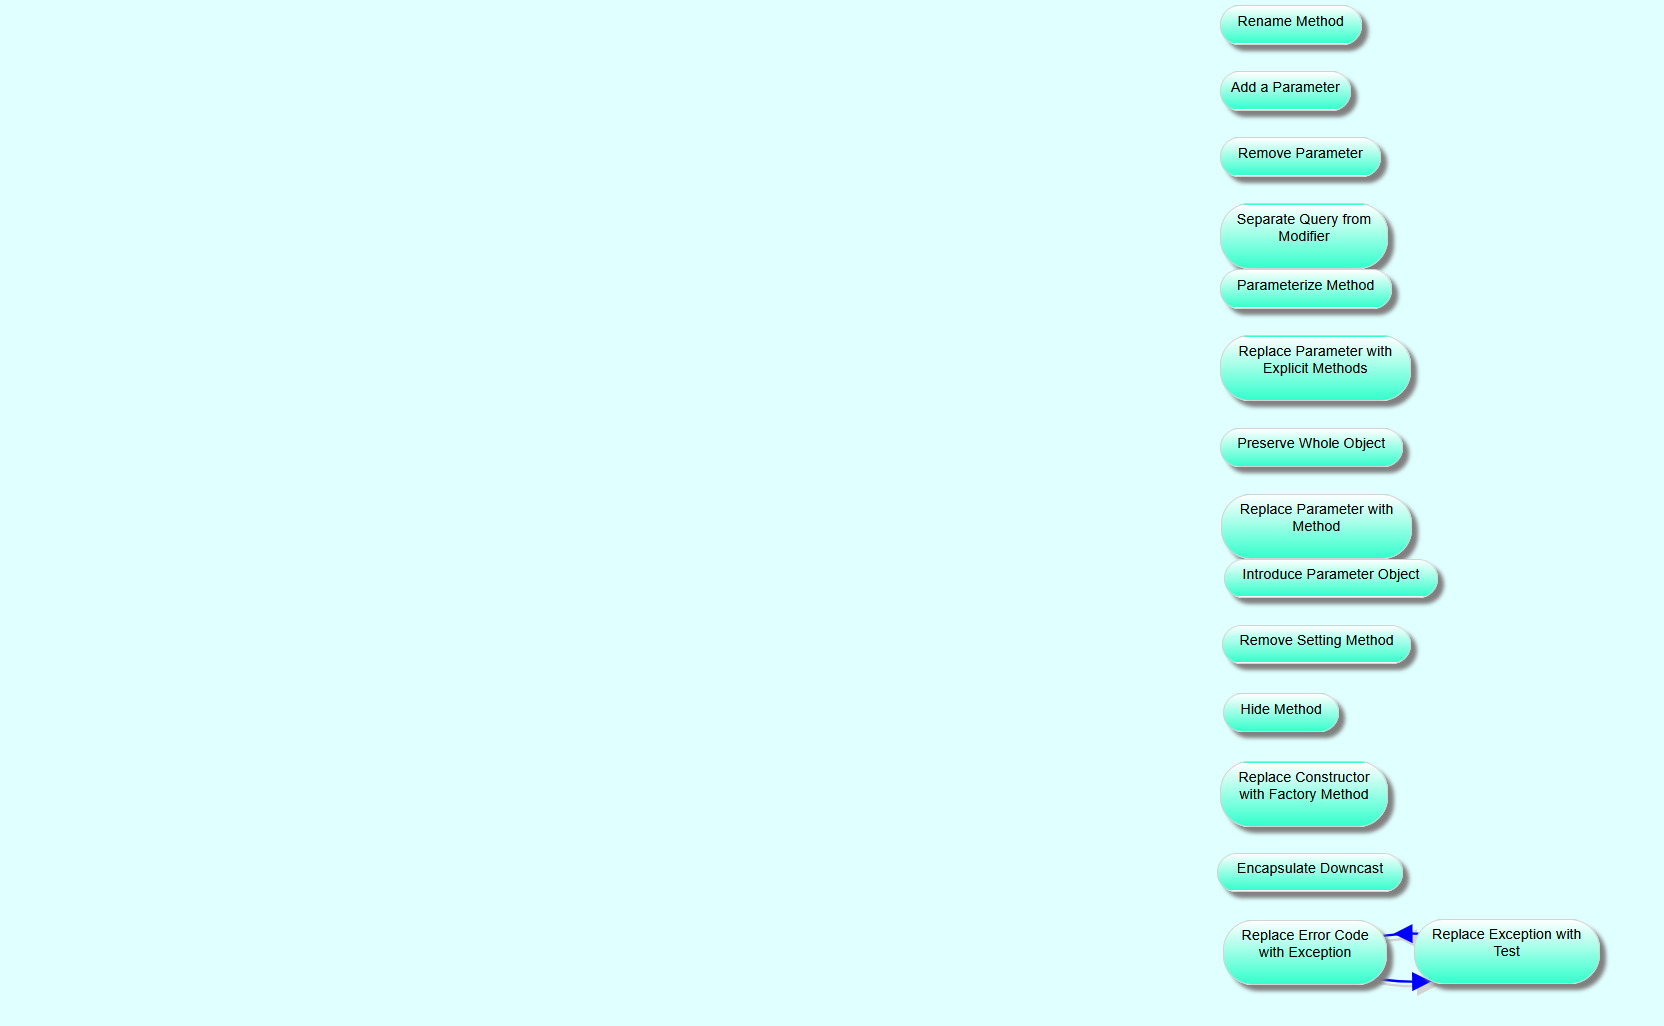
More specifically, a visualisation of Martin Fowler's refactorings for OO programmers.
A visualisation of Java FX controls and their inheritance structure.
To understand something, we need more than a collection of facts. We need to know what the individual pieces of information are, how they relate to one another, and which pieces are most important.
Organising information into categories is also essential. For example, we may want to distinguish between things that are important, things that explain something else, things that require action, or things that are alternatives.
Yet much of the information we receive arrives in a linear form: we read sentences one after another, or listen to someone speaking one word after another.
It is rather like watching items pass along a conveyor belt. We encounter each item in sequence, deciding as we go which ones deserve our attention.
But understanding is not simply a sequence of isolated pieces of information. As we read or listen, we try to construct a mental picture: What belongs together? What causes what? What is important? What is an example of what? What should I do?
This is where visual thinking can help. By representing information spatially, we can make relationships, categories and priorities visible rather than having to keep them entirely in our heads.
When you visualise information in SortYourThoughts, each item can be positioned in relation to the others, while connections between items are represented by arrows. Categories can be represented spatially as well.
In fact, we often do this naturally when we explain something. When you start pointing at things, drawing a diagram, or waving your hands to show how different things relate to one another, you are adding information that is difficult to express through words alone. You are moving beyond the purely linear structure of speech.
A concept map makes this additional structure explicit and persistent. Instead of having to reconstruct the relationships in your head every time, you can see the structure of the information.
There is another important reason to structure information visually: working memory is limited. We cannot hold an unlimited number of separate pieces of information in our immediate attention. Early research often referred to a limit of around seven items, but subsequent research suggests that the practical capacity may be considerably smaller, often around three to five meaningful items, depending on the circumstances.
This makes complex information difficult to understand when everything has to be processed as a sequence of words.
Consider the difference between being given a verbal description of a town and being shown a map. A verbal description might tell you where each street is and how to get from A to B. A map, however, lets you see many of those relationships simultaneously, understand the overall layout and get an overview.
Something similar happens when you build a concept map. While reading or listening, you are already trying to construct a mental model of the information: grouping related ideas, identifying connections and deciding what matters.
Why repeat that work over and over again in your head?
Map your ideas on the screen once, and you create an external representation of your understanding. Later, you can return to the map and immediately see the structure you created, rather than having to reconstruct it from a linear text.
And because SortYourThoughts is collaborative, you can share that representation of your understanding with other people. You can invite them to view your map, discuss it with you, or even edit it together.
Finally, a map does not have to show everything at once. As it grows, you can filter out information you don't currently need. By showing only the relevant parts of the map, you can reduce the amount of information competing for your attention and make complex subjects easier to explore.
Concept maps turn information from a sequence into a structure. They make relationships, categories and priorities visible, helping us externalise part of the mental work involved in understanding complex information.
